Overview
Project Title: Financial Dashboard Design and Development
Client: [Client Name]
Project Duration: [Start Date] – [End Date]
Technologies Used: React, Node.js, Express, MongoDB, D3.js, Chart.js, Bootstrap
Project Description
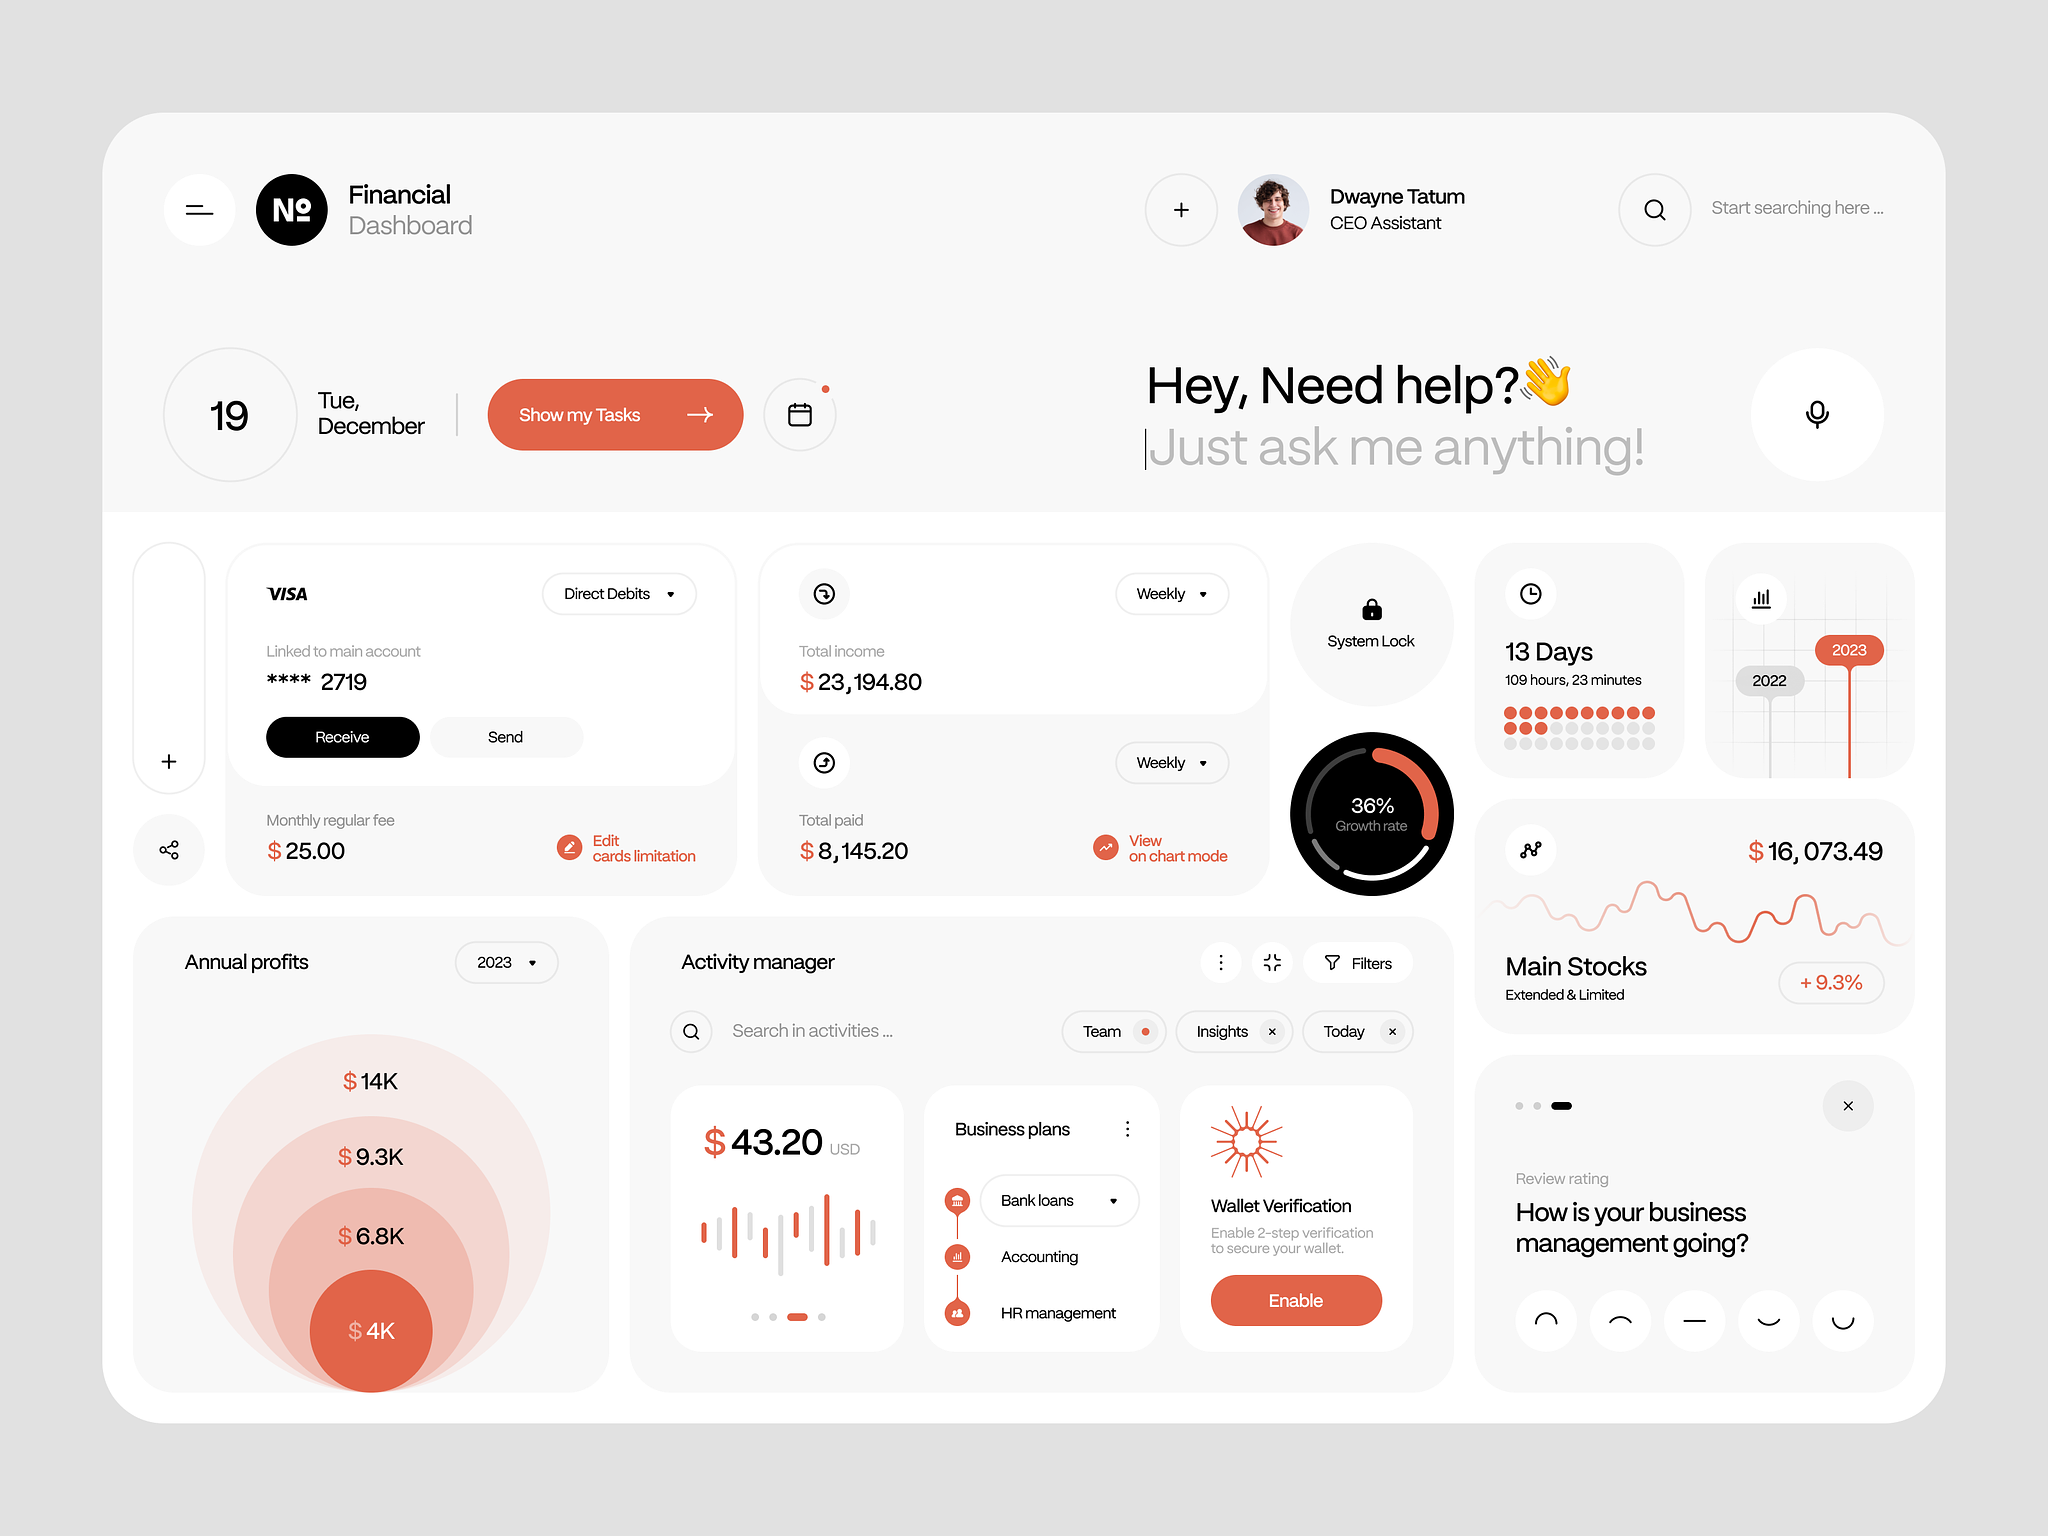
The Financial Dashboard project aimed to create a comprehensive and interactive platform for managing financial data, providing users with real-time insights into their financial status. The dashboard integrates various financial metrics, including revenue, expenses, and profit margins, while allowing users to visualize trends and make data-driven decisions.
Key Features
1. Interactive Data Visualization:
•Charts and Graphs: Implemented using Chart.js and D3.js to display revenue, expenses, and profit margins dynamically.
•Customizable Dashboards: Users can choose which metrics to display and adjust the layout according to their preferences.
2. Real-Time Data Integration:
•API Integration: Developed a robust API with Node.js and Express to fetch and manage real-time financial data from various sources.
•Live Data Updates: Enabled automatic updates for financial metrics to reflect the latest data without requiring manual refreshes.
3. User Management and Authentication:
•Secure Login: Implemented JWT-based authentication for secure user access.
•Role-Based Access Control: Different levels of access for administrators, managers, and regular users to manage financial data and view dashboards.
4. Custom Reports and Alerts:
•Report Generation: Provided functionality for users to generate and download custom financial reports in PDF and Excel formats.
•Automated Alerts: Set up email notifications and in-app alerts for significant financial changes or anomalies.
5. Responsive Design:
•Mobile-Friendly: Ensured that the dashboard is fully responsive and accessible on both desktop and mobile devices using Bootstrap for layout consistency.
6. Data Filtering and Search:
•Advanced Filtering: Allowed users to filter financial data by date range, categories, and specific metrics.
•Search Functionality: Implemented a search feature to quickly locate specific financial records or reports.
Development Process
1. Requirements Gathering:
•Conducted meetings with stakeholders to understand the key requirements and objectives of the financial dashboard.
2. Wireframing and Prototyping:
•Created wireframes and interactive prototypes to visualize the dashboard layout and user interactions.
3. Design and Development:
•Frontend: Developed the user interface using React, ensuring a smooth and intuitive user experience.
•Backend: Built the server-side application with Node.js and Express to handle data processing and API management.
•Database: Implemented MongoDB for storing financial records and user data securely.
4. Testing and Deployment:
•Performed extensive testing to ensure functionality, security, and performance.
•Deployed the application on AWS with continuous integration and continuous deployment (CI/CD) pipelines.
5. Maintenance and Support:
•Provided ongoing support for bug fixes, updates, and additional feature requests.
Challenges and Solutions
•Challenge: Integrating real-time data updates efficiently without affecting performance.
•Solution: Implemented WebSockets for real-time data push and optimized API endpoints for faster data retrieval.
•Challenge: Ensuring cross-device compatibility and responsiveness.
•Solution: Utilized Bootstrap and responsive design principles to achieve a consistent user experience across all devices.
Results
•Increased Efficiency: Streamlined financial data management, reducing manual processing time by 40%.
•Enhanced Decision-Making: Provided actionable insights through dynamic data visualization, leading to more informed financial decisions.
•User Satisfaction: Achieved a 95% satisfaction rate among users, with positive feedback on the dashboard’s usability and features.
Testimonials
“The financial dashboard has transformed our data management process. The real-time updates and customizable features have greatly improved our decision-making capabilities.” – [Client Name]
“Exceptional work! The dashboard is both visually appealing and highly functional. The team was responsive and delivered on time.” – [Client Name]
Feel free to customize this entry further based on specific details and outcomes related to your project.

